News,
Pakistan and Canada Trade
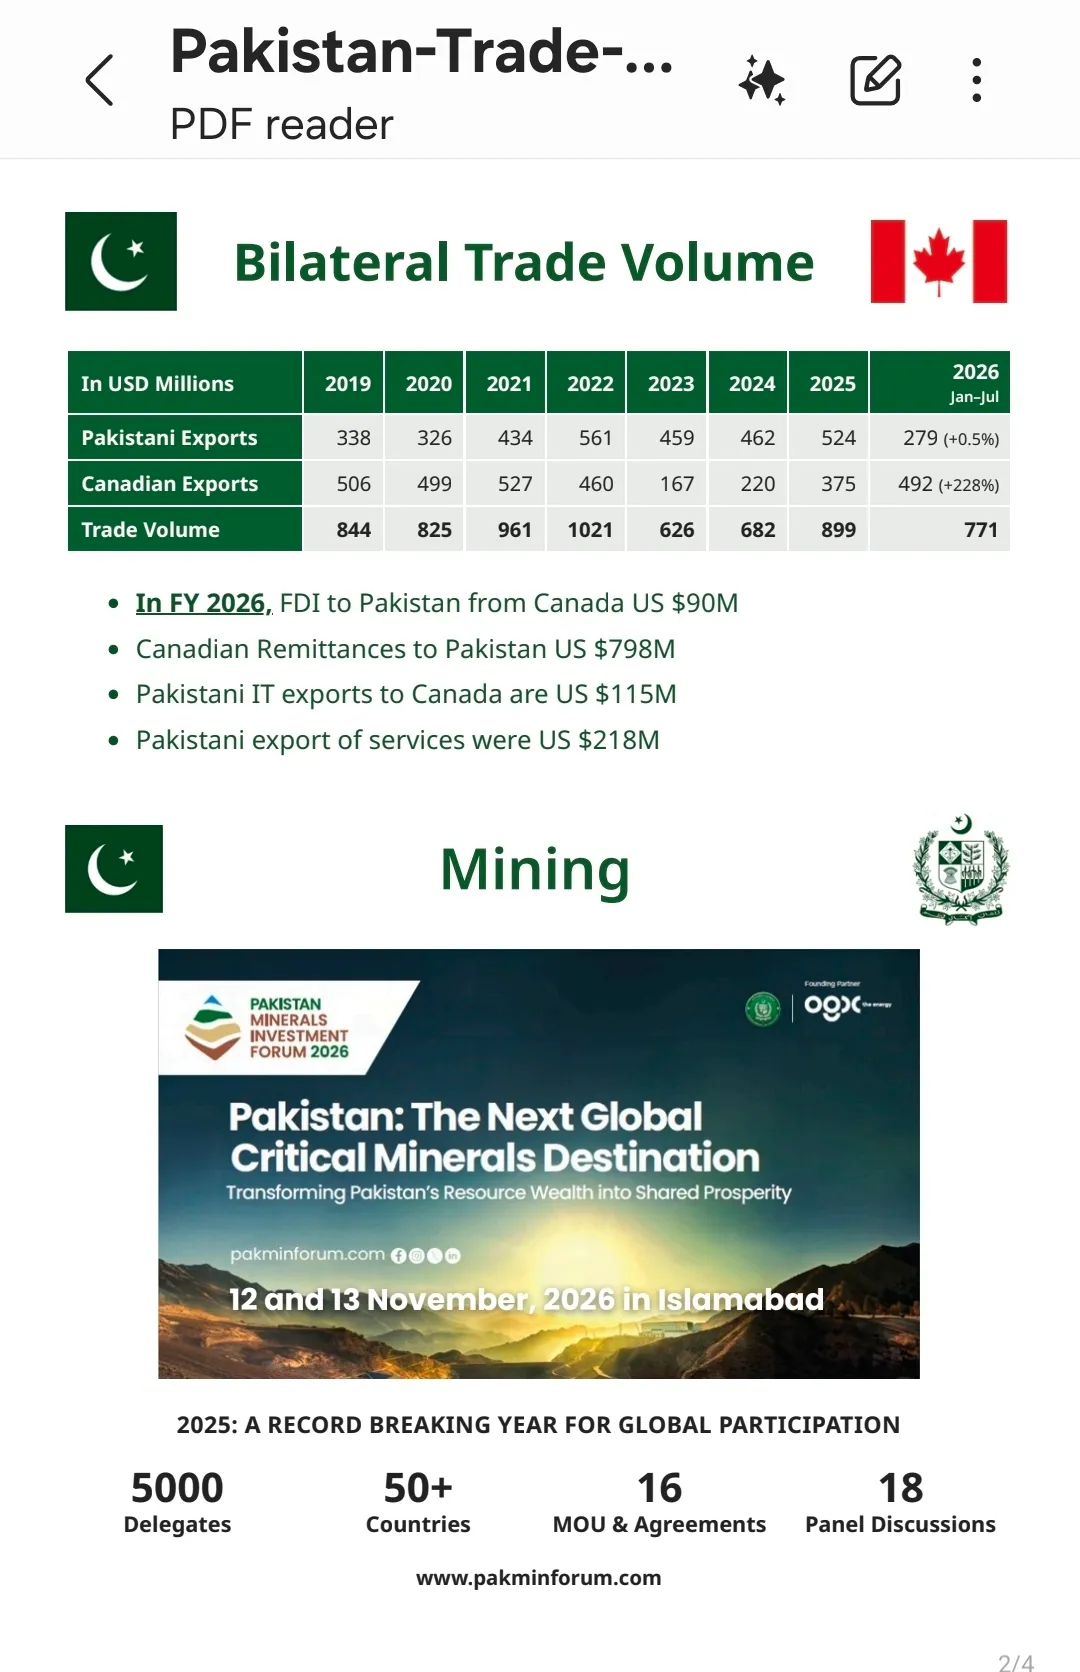
Pakistan and Canada trade summary shows steady growth and great opportunities for traders and investors of both countries .

Pakistan–Canada Trade Brief
3 October 2026 · AJ
Canada’s merchandise trade with Pakistan reached C$1,065.7 million in January–July 2026, up 78% from C$598.9 million a year earlier. Seven months of 2026 already come close to the full-year totals for 2021, 2022 and 2025. Canada swung from a deficit of C$179.3M to a surplus of C$295.7M, almost entirely because Pakistan resumed buying Canadian canola. Figures are Statistics Canada data in Canadian dollars, pulled from Trade Data Online on 3 October 2026, unless marked US$.
Major trends
Canola reopening drives the jump. Canola seed was C$444.0M, or 65.2% of Canada’s exports to Pakistan, in January–July 2026, after none in 2023 and 2024. Pakistan closed its market to genetically modified canola in late 2022, and the two countries agreed to restart the trade on 3 November 2025.
Canadian exports tripled. Exports rose from C$209.8M in January–July 2025 to C$680.7M in January–July 2026 (up 224.5%), already more than every full year from 2018 to 2025.
Pakistan’s exports to Canada are steady and large. Canada imported C$696.2M from Pakistan in 2025, almost twice the C$364.0M of 2016. Imports were flat in January–July 2026 (C$385.0M, down 1.0%). They are mainly home textiles, clothing, leather goods and rice.
The balance flips with canola. Pakistan had a surplus with Canada every year from 2022 to 2025, peaking at C$395.0M in 2023. With canola back, Canada is in surplus again (C$295.7M in January–July 2026).
Trade is regionally split. The Prairie provinces supply 82% of Canada’s exports to Pakistan, while Ontario, Quebec and British Columbia take 92% of Canada’s imports from Pakistan.
Merchandise trade balance, 2016 to 2026 year to date
Canada ran a surplus with Pakistan from 2016 to 2021, then a deficit from 2022 to 2025 as canola stopped and imports grew. Two-way trade was C$1.0–1.4 billion a year before the canola halt, fell to C$845.3M in 2023, and recovered to C$1,195.4M in 2025.
Period
Exports to Pakistan (C$ M)
Imports from Pakistan (C$ M)
Balance (C$ M)
Total trade (C$ M)
2016
1,078.5
364.0
+714.5
1,442.5
2017
747.0
410.8
+336.1
1,157.8
2018
609.6
436.2
+173.4
1,045.8
2019
672.6
449.5
+223.1
1,122.0
2020
668.9
438.2
+230.7
1,107.1
2021
660.5
543.9
+116.6
1,204.3
2022
598.1
730.4
-132.3
1,328.5
2023
225.1
620.2
-395.0
845.3
2024
302.8
635.3
-332.4
938.1
2025
499.1
696.2
-197.1
1,195.4
Jan–Jul 2025
209.8
389.1
-179.3
598.9
Jan–Jul 2026
680.7
385.0
+295.7
1,065.7
Source: Statistics Canada, via ISED Trade Data Online. In US dollars, January–July trade was US$427.1M in 2025 and US$770.3M in 2026 (exports US$491.9M, imports US$278.4M).
Top Canadian exports to Pakistan
Canola and pulses (lentils, chickpeas and peas) make up most of Canada’s exports to Pakistan. Ferrous scrap is the third pillar, worth C$45–73M a year except in 2023. Sawn lumber, worn clothing, newsprint and computers are steady smaller lines. New in 2025–26 are potash (C$12.9M in 2025, from Saskatchewan), polyethylene (C$7.3M in January–July 2026) and gas turbines (C$14.4M in January–July 2026, up from C$1.4M).
Product (HS code)
2021
2022
2023
2024
2025
Jan–Jul 2026
Canola seed (1205)
271,557
239,676
–
–
107,178
444,032
Dried pulses (0713)
109,566
182,154
67,091
77,599
169,399
103,111
Ferrous scrap (7204)
64,258
45,113
20,684
72,647
61,881
41,140
Sawn lumber (4407)
23,814
16,513
14,115
15,600
25,553
13,613
Worn clothing (6309)
20,544
24,102
21,552
26,220
23,299
12,615
Newsprint (4801)
10,734
9,436
13,995
20,318
12,222
2,821
Computers and parts (8471)
13,574
13,229
11,015
11,781
8,904
6,304
Total, all products
660,481
598,102
225,119
302,839
499,123
680,707
Values in C$ thousands. In 2021, C$118.4M of exports fell outside the top 25 product groups.
Top Canadian imports from Pakistan
Canada mainly buys home textiles, clothing and leather goods from Pakistan. The seven textile and clothing lines in the table were worth C$384.6M in 2025, 55% of all imports. Food is growing: rice reached C$28.5M in 2024, and sauces and condiments quadrupled from C$4.0M in 2021 to C$16.0M in 2025. Plastic resins (HS 3907) fell from C$63.5M in 2022 to C$19.0M in 2025. In January–July 2026 imports were flat, with men’s trousers (+6.8%) and T-shirts (+14.2%) up and leather apparel (−19.8%) and rice (−25.5%) down.
Product (HS code)
2021
2022
2023
2024
2025
Jan–Jul 2026
Bed, table and kitchen linen (6302)
57,100
71,285
67,486
73,561
79,690
42,075
Leather apparel and gloves (4203)
49,701
70,669
64,151
52,932
64,545
30,801
Knit pullovers and cardigans (6110)
38,496
59,744
56,034
53,066
62,953
27,898
Men’s suits, trousers, shorts (6203)
33,184
55,801
52,418
48,653
61,424
34,602
Women’s suits, dresses, trousers (6204)
30,597
46,267
44,710
44,965
59,283
33,348
Hosiery and socks (6115)
17,750
20,201
17,595
22,773
35,759
17,079
Rice (1006)
17,651
22,293
24,825
28,457
27,206
13,289
T-shirts (6109)
8,601
17,294
17,841
17,695
20,966
13,382
Plastic resins (3907)
44,773
63,541
27,922
37,807
19,049
15,898
Sauces and condiments (2103)
3,977
6,795
9,616
11,382
16,019
10,064
Total, all products
543,850
730,437
620,155
635,278
696,236
385,024
Values in C$ thousands, ranked by 2025 value.
Trade by province
Saskatchewan alone supplied half of Canada’s exports to Pakistan in January–July 2026, and the three Prairie provinces 82%. Ontario is the main entry point for Pakistani goods, with 60% of imports, followed by Quebec and British Columbia. Imports are recorded by province of clearance, so they show where goods enter Canada, not where they are used.
Province
Exports to Pakistan (C$ M)
Share of Canada’s exports
Imports from Pakistan (C$ M)
Share of Canada’s imports
Saskatchewan
336.9
49.5%
1.5
0.4%
Alberta
153.5
22.5%
15.1
3.9%
Manitoba
70.2
10.3%
7.1
1.8%
Ontario
42.5
6.2%
229.8
59.7%
Quebec
34.0
5.0%
63.1
16.4%
Nova Scotia
27.9
4.1%
1.4
0.4%
British Columbia
12.7
1.9%
59.6
15.5%
Newfoundland and Labrador
1.8
0.3%
0.03
0.0%
New Brunswick
1.3
0.2%
7.4
1.9%
Prince Edward Island
0.05
0.0%
–
–
Canada
680.7
100%
385.0
100%
January–July 2026. Detailed briefs: Saskatchewan, Alberta, Manitoba.
Services, remittances and investment
Beyond goods, money flows from Canada to Pakistan are large and rising. Remittances from Canada are worth more than Canada’s merchandise imports from Pakistan, and investment from Canada jumped in mid-2026. These figures are from the State Bank of Pakistan, in US dollars, as of August 2026.
Flow (US$ M)
2023
2024
2025
Jan–Aug 2025
Jan–Aug 2026
Workers’ remittances from Canada
484.3
570.0
743.5
488.1
556.8
Pakistan’s services exports to Canada
149.8
210.3
201.1
132.2
147.3
Pakistan’s services imports from Canada
110.4
108.0
98.9
64.3
112.1
Net foreign direct investment from Canada
-0.95
127.9
44.0
43.7
123.1
Remittances from Canada were a record US$798.4M in fiscal year 2026 (July 2025–June 2026), up 21% on the year before.
Pakistan’s services exports to Canada have grown sevenfold from US$29.9M in 2016.
Most of the 2026 investment came in June–August (US$122.6M over three months).
Source: State Bank of Pakistan, EasyData (country-wise remittances, services trade and foreign investment series).
Sources
Statistics Canada via ISED Trade Data Online: trade by province, partner and HS code
State Bank of Pakistan, EasyData: foreign investment, remittances and services trade by country
Statistics Canada: Portrait of the South Asian Populations in Canada (2025)
Statistics Canada: 2016 Census Profile
Global Affairs Canada: Canada–Pakistan joint statement (Jul 2026)
Global Affairs Canada: Minister Anand advances Canada’s bilateral relations with Pakistan (Jul 2026)
Radio Pakistan: Pakistan, Canada sign protocol on import of canola (20 Jul 2026)
CTV News/Reuters: Canada and Pakistan agree to facilitate canola trade (3 Nov 2025)
Manitoba Co-operator: Pakistan is back buying Canadian canola
Canada–Pakistan income tax convention (1976) and FBR tax treaty list
UNCTAD: international investment agreements, Pakistan